

You can see from the table above that the y value is 0 when x = -5 and x = 5

It can also be seen from the graph above that the zeros
(where the function crosses the x-axis)
are at x = -5 and x = 5
You can see from the table above that the y value is 0 when x = -5 and x = 5
It can also be seen from the graph above that the zeros
(where the function crosses the x-axis)
are at x = -5 and x = 5

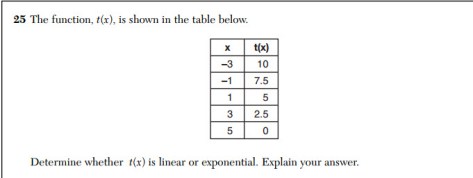
Linear vs Exponential
Look at the pattern of t(x) which are the y values.
Every time x goes up by 2 (from -3 to -1, or -1 to 1, 1 to 3, or 3 to 5), t(x) goes down by 2.5.
This means that there is a constant rate of change or slope and that the function is linear.
These points can be plotted on graph paper to see if they will make a line which they do :)
Here is some more practice from the awesome site www.emathinstruction.com
https://emathinstruction.com/wp-content/uploads/2014/11/CCAlg1-U6L8-Linear-Versus-Exponential.pdf
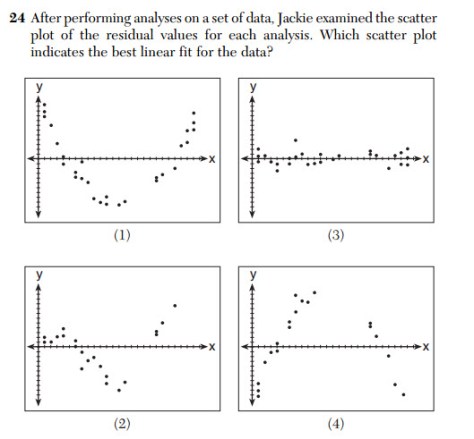
Residuals show how far the data is from the line of best fit.
If a line is a good fit for the data, then the residuals will be about half below and half above the x axis. The residuals will also be close to the x-axis which means that their values are fairly small.
If the residual plot shows a pattern (see below), then a linear will not be a good fit. See the link from Math Bits below:
http://mathbitsnotebook.com/Algebra1/StatisticsReg/ST2Residuals.html
Looking at the 4 choices, which looks most like the the left most graph that says “Random, No Pattern. Linear Appropriate”?
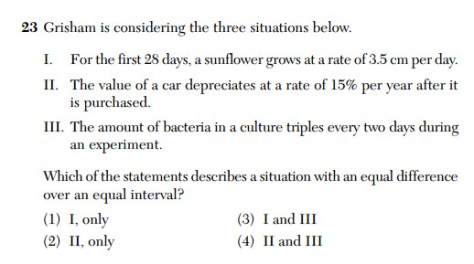
This question could be called Linear vs Exponential as it asks for linear with fancy wording: “equal difference over an equal interval”(as opposed to just the word linear)
(I) 3.5 cm a day would make the y values go up 3.5 each day this is linear
(II) depreciate 15% a year is exponential
(III) tripling is exponential
see #25 on this Regents for long answer of linear or exponential!!
