Linear vs Exponential
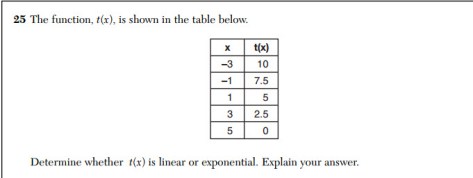
Look at the pattern of t(x) which are the y values.
Every time x goes up by 2 (from -3 to -1, or -1 to 1, 1 to 3, or 3 to 5), t(x) goes down by 2.5.
This means that there is a constant rate of change or slope and that the function is linear.
These points can be plotted on graph paper to see if they will make a line which they do :)
Here is some more practice from the awesome site www.emathinstruction.com
https://emathinstruction.com/wp-content/uploads/2014/11/CCAlg1-U6L8-Linear-Versus-Exponential.pdf
