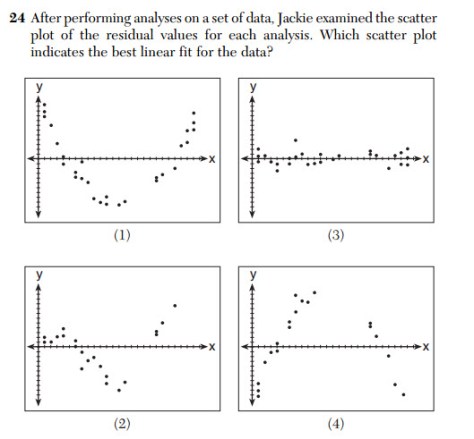
Residuals show how far the data is from the line of best fit.
If a line is a good fit for the data, then the residuals will be about half below and half above the x axis. The residuals will also be close to the x-axis which means that their values are fairly small.
If the residual plot shows a pattern (see below), then a linear will not be a good fit. See the link from Math Bits below:
http://mathbitsnotebook.com/Algebra1/StatisticsReg/ST2Residuals.html
Looking at the 4 choices, which looks most like the the left most graph that says “Random, No Pattern. Linear Appropriate”?
