
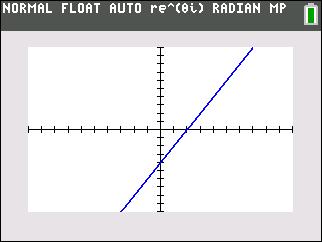
Um, so this graph looks like which graph above??
Match it pick it — 2 more points!!!
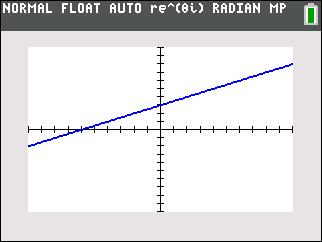
Um, so this graph looks like which graph above??
Match it pick it — 2 more points!!!
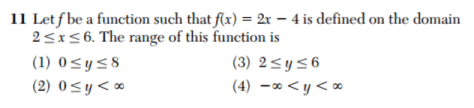
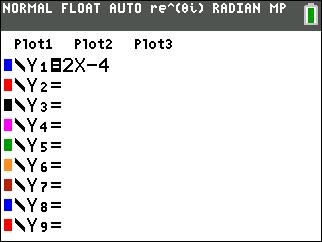

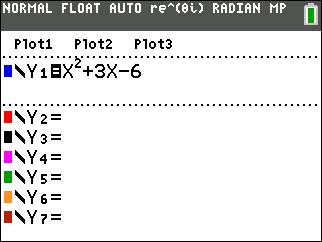
Look at the table for the y values from x = 2 to x = 6
The points are:
(2,0)
(3,2)
(4,4)
(5,6)
(6,8)
Notice that the lowest y value is 0 and the highest is 8.
PS the way this question is written you do not have to know that range means the y values and domain means the x values as all of the answer choices have “y”
If you do need to remember this:
x comes before y in the alphabet and
domain comes before range!!
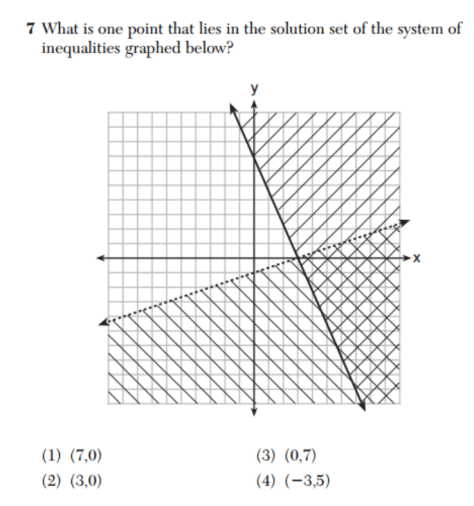 We are looking for the point out of the four listed that lies in the double hatched area on the right lower part of the graph. (below the dotted line and above the solid line).
Be mindful of how (7,0) and (0,7) differ
Can use the 2nd Draw menu: It can barely be seen on the x-axis but check out the graph below carefully and you will see a dot at (7,0). See the double hatched area above!
That’s it — 2 more points :)


The key word here is NOT
Look at the table and see which point is not listed
That’s 2 points :)


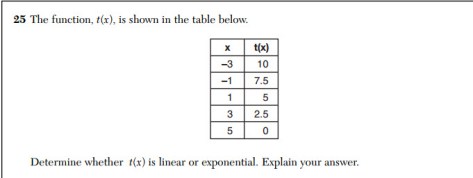
Linear vs Exponential
Look at the pattern of t(x) which are the y values.
Every time x goes up by 2 (from -3 to -1, or -1 to 1, 1 to 3, or 3 to 5), t(x) goes down by 2.5.
This means that there is a constant rate of change or slope and that the function is linear.
These points can be plotted on graph paper to see if they will make a line which they do :)
Here is some more practice from the awesome site www.emathinstruction.com
https://emathinstruction.com/wp-content/uploads/2014/11/CCAlg1-U6L8-Linear-Versus-Exponential.pdf
