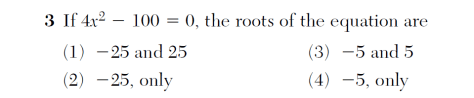


You can see from the table above that the y value is 0 when x = -5 and x = 5

It can also be seen from the graph above that the zeros
(where the function crosses the x-axis)
are at x = -5 and x = 5
You can see from the table above that the y value is 0 when x = -5 and x = 5
It can also be seen from the graph above that the zeros
(where the function crosses the x-axis)
are at x = -5 and x = 5
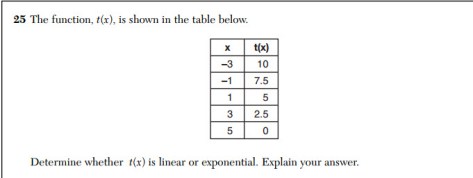
Linear vs Exponential
Look at the pattern of t(x) which are the y values.
Every time x goes up by 2 (from -3 to -1, or -1 to 1, 1 to 3, or 3 to 5), t(x) goes down by 2.5.
This means that there is a constant rate of change or slope and that the function is linear.
These points can be plotted on graph paper to see if they will make a line which they do :)
Here is some more practice from the awesome site www.emathinstruction.com
https://emathinstruction.com/wp-content/uploads/2014/11/CCAlg1-U6L8-Linear-Versus-Exponential.pdf
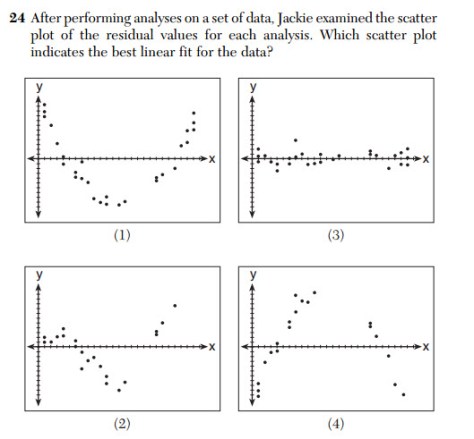
Residuals show how far the data is from the line of best fit.
If a line is a good fit for the data, then the residuals will be about half below and half above the x axis. The residuals will also be close to the x-axis which means that their values are fairly small.
If the residual plot shows a pattern (see below), then a linear will not be a good fit. See the link from Math Bits below:
http://mathbitsnotebook.com/Algebra1/StatisticsReg/ST2Residuals.html
Looking at the 4 choices, which looks most like the the left most graph that says “Random, No Pattern. Linear Appropriate”?
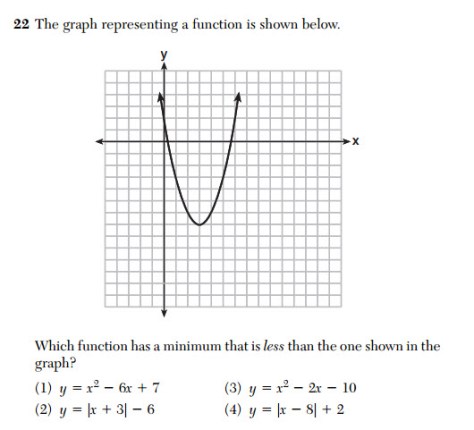
Look at the graph above the minimum y value is -7 at the point (-3,-7).
We are looking for the y = that goes even lower!!


Above is answer choice (1). You can see the minimum y value is -2 (not less than -7)


Above is answer choice (2). You can see the minimum y value is -6 (not less than -7)


Above is answer choice (3). Whoa this one goes low!! Lower than the y value of the given graph way up above


Above is answer choice (4). This graph does not go very low — it doesn’t even pass through the x-axis as its minimum y value is 2.
From the Jan 2016 Common Core Algebra I Regents:
The level of challenge on the Regents like any exam varies quite a bit.
After posting about #1-19 of the Jan 2016 Common Core Algebra I Regents, challenge level is being added to each problem.
Please comment if you feel a problem is misclassified as I am only right about 80% of the time. Most importantly, students need to know what they find easy medium hard (often abbreviated as EMH)
 c
c
click on the word easy for blog posts for Jan 2016 1 3 4 5 8 9 12 15 16
click on the word medium for blog posts for Jan 2016 2 7 13 14 17 18 19
click on the word hard for blog posts for Jan 2016 6 10 11 20
