Category Archives: Common Core Algebra I

Get the Math and the Points Aug 2014 CC Alg I #7

Aug 14 CC Algebra 1 7
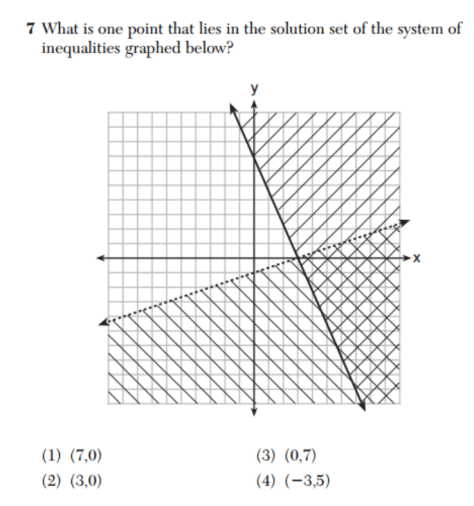
We are looking for the point out of the four listed that lies in the double hatched area on the right lower part of the graph.  (below the dotted line and above the solid line).
Be mindful of how (7,0) and (0,7) differ
Can use the 2nd Draw menu:  It can barely be seen on the x-axis but check out the graph below carefully and you will see a dot at (7,0).  See the double hatched area above!
That’s it — 2 more points :)


Get the Math and Points Jan 2016 CC Alg I #25

Jan 2016 A1 25

Linear vs Exponential
Look at the pattern of t(x) which are the y values.
Every time x goes up by 2 (from -3 to -1, or -1 to 1, 1 to 3, or 3 to 5), t(x) goes down by 2.5.
This means that there is a constant rate of change or slope and that the function is linear.
These points can be plotted on graph paper to see if they will make a line which they do :)

Here is some more practice from the awesome site www.emathinstruction.com

https://emathinstruction.com/wp-content/uploads/2014/11/CCAlg1-U6L8-Linear-Versus-Exponential.pdf


Get the Stats and Get the Points CC Alg I Jan 2016 #24

Jan 2016 A1 24

Residuals show how far the data is from the line of best fit.
If a line is a good fit for the data, then the residuals will be about half below and half above the x axis.  The residuals will also be close to the x-axis which means that their values are fairly small.
If the residual plot shows a pattern (see below), then a linear will not be a good fit.  See the link from Math Bits below:
http://mathbitsnotebook.com/Algebra1/StatisticsReg/ST2Residuals.html
Looking at the 4 choices, which looks most like the the left most graph that says “Random, No Pattern.  Linear Appropriate”?