In a box plot as shown below, there are 5 values:
Minimum (lowest), Lower Quartile (25th percentile), Median (50th percentile), Upper Quartile (75th percentile) and Maximum (highest).
Notice that the question above has the word not in it.

In a box plot as shown below, there are 5 values:
Minimum (lowest), Lower Quartile (25th percentile), Median (50th percentile), Upper Quartile (75th percentile) and Maximum (highest).
Notice that the question above has the word not in it.
When putting the answer choices into the TI-84 we can see that the only match is II.
Analyzing a graph can teach students about the zeros or solutions of a function. This function passes through the x-axis 3 times: at x = -2, x = 1 and x =3. We can also use this question to talk about factoring, y-intercepts, end behavior and other cool Math ideas. The process of elimination is very rewarding as compare/contrast is a great way to learn content and metacognition.
I am in favor of students knowing the Math part of this for sure but with the TI-84 , they can get the Math and get points. The 2 points on this type of question may make the difference between Pass and Fail and perhaps even high school graduation. The problem below comes from the June 2015 Algebra I Regents.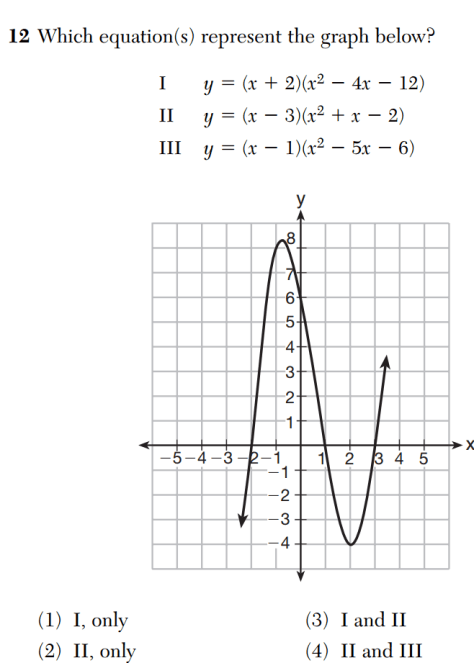

 Option I is a NO GO so answers (1) and (3) are OUT.


Option II looking good — it’s a keeper!!


Option III is a NO GO

