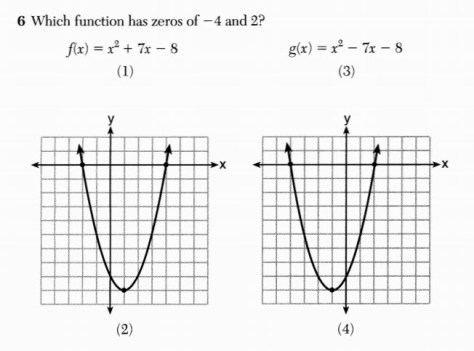
We can already analyze the two graphs above for the zeros.
Notice how (2) crosses the x-axis at (-2,0) and (4,0) at the ‘dots’ on the x-axis so that’s not right as we are looking for zeros of -4 and 2 (close but opposite signs)>
Ok let’s check out (4)…
Notice how (4) crosses the x-axis at (-4,0) and (2,0)? :)
(If we had to check (1) and (3), we would put each equation into Y= and check out the graph and/or table but no need to do that this time around)
